TL;DR: MapLibre Symbol Utils is a new plugin for MapLibre GL JS that allows you to create line pattern fills for your layers or use the MapLibre default marker class (which is very flexible) as an icon image for your point layers.
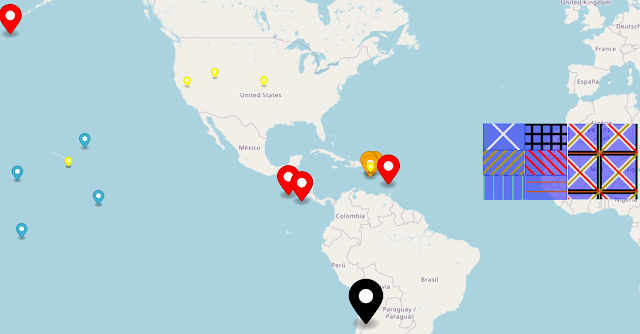
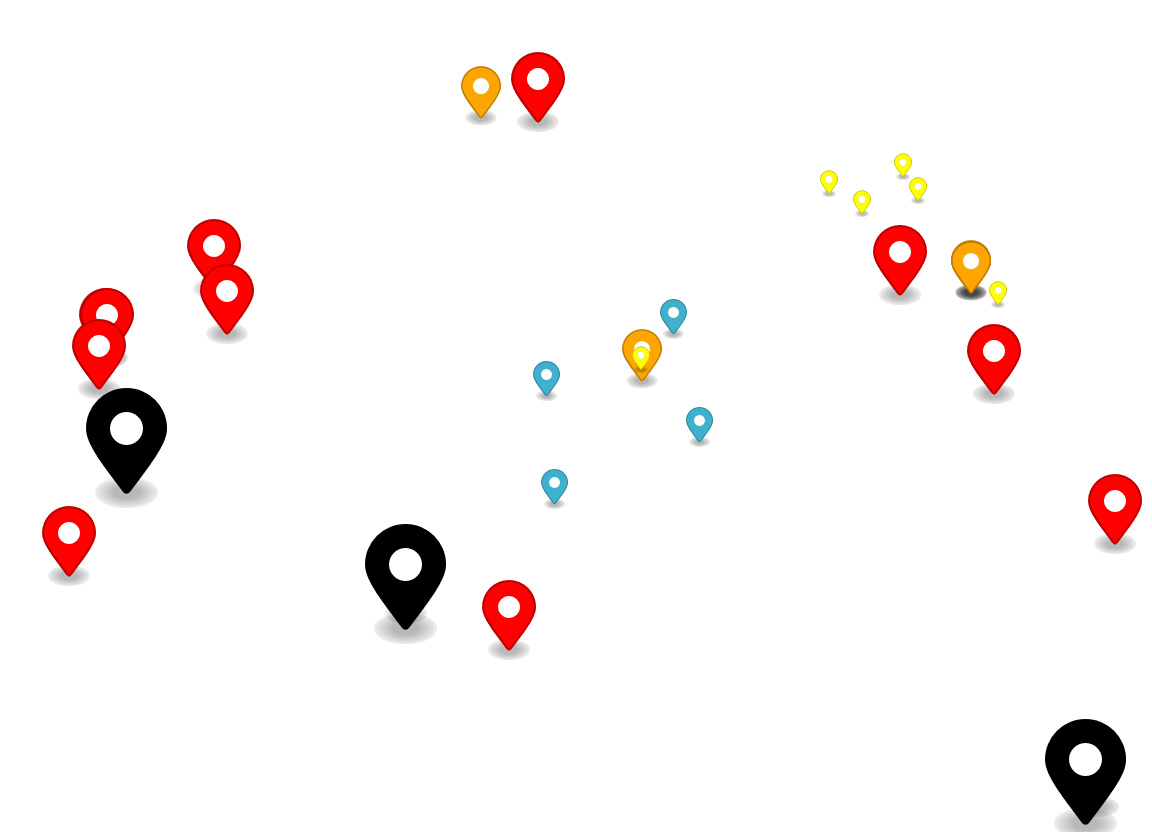
You can see some examples of the changes in color and size in the marker and the different patterns in the image below and find the plugin at GitHub or install it through NPM.
You can see in the image below what you can do with it.
Now for the long version:
About 2 years ago, I had an idea.
I love working with MapLibre and about 2 years ago I was in the middle of creating a pretty big system with it, when I was stuck.
The system used a MapLibre front end but all the layers came from ArcGIS Server, where the main point of the system was to display the symbology for the layers as it was defined in ArcGIS Server.
In theory that is possible for most cases (Not in practice because ArcGIS Server does not return the full rendering information for layers with complex symbology, just part of it), because point layers usually use simple symbols (circle, square, diamond, etc.) that can be easily recreated, lines are usually published with simple symbology and polygons in 90% of cases are just simple fill polygons with a stroke in a different color.
But that still leaves you with the edge cases, the more complex symbols like line pattern\hatch fill polygons.
At least in Israel they are used a lot in the public sector since they allow the creation of a great number of class breaks based on the same field (for example the code for land use designation).
Now here comes the idea.
I remembered the MapLibre example about generating an icon to be used in the map, and actually read the documentation to see how it works and why is it accepted as an image.
If you read my post about using the marker for an entire layer, you might already know where this is heading, but basically the idea is you can create an object that will be added to the map as an image in multiple ways, either as a JS or HTML image object, use image data or return what can processed as a StyleImageInterface.
Basically, you need something that MapLibre can identify as an image, or something that it can tell to render an image from.
Having played around with HTML canvas a bit before, I figured it was worth a shot to try and create functions that will create an image from a canvas and add that image to the map, pretty close to what I did with the markers, but on a bigger scale.
I wrote a POC, and figured I’ll get to packaging it eventually, which (good for you if you needed it) is now.
Using the MapLibre Symbol Utils plugin, you can create and add images with line patterns to the map in a pretty simple way.
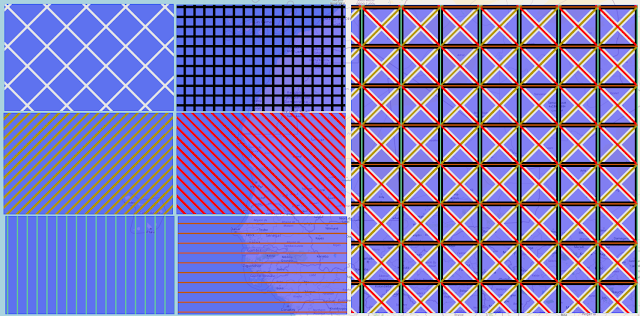
There are 6 different patterns,
but you don’t actually have to be limited to using just one,
the canvasFill class allows you to create an image with multiple line elements in it,
you can see in the image below this 6 different patterns, each in their own polygon,
and all of the combined in the rightmost polygon.
In the GitHub repository there are a couple of simple code examples and some further explanation on the also wrapped function for creating image using the existing MapLibre Marker class, which again, is very versatile and worth checking out since it can save you a lot code when come to displaying your point layers as markers.
Since this is mostly a hobby project, I don’t have any current development plan for it, but any suggestions and ideas are welcome, and as always I love getting hearing input about stuff I built, especially if it’s ideas on how to improve.